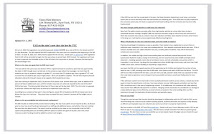
 Check out my oped in today’s Daily News, calling the new school grading system a “fiasco” and pointing out the reasons why.
 It ends this way:
The new grades are merely another simplistic, misleading attempt by this administration to look tough - and evade its duty to improve our schools.
(Click on the picture to the right to enlarge it.)
Not surprisingly, the NY Post ran an oped in support the new grades– written by a charter school operator. Interesting that DOE could apparently find no one involved with a traditional public school to back them up.
What’s especially ironic is that the Post also ran an article on p.2 revealing that charter schools have been exempted from receiving grades – supposedly because the DOE can’t require their parents and staff to fill out the surveys.
The Daily News ran an excellent article, entitled “How a good school fails.”
How can this be so? Because last year, only 35% of its students improved their scores over the year before in reading, and only 23% in math.
While many excellent schools like PS 35 received “F"s yesterday, a lot of struggling schools also received “A"s.
So if a school was on the state failing list, it was far more likely to get an A than a D or F. The distribution of grades of schools on the failing list was remarkably similar to schools citywide: 19% As, 36% Bs, 31% Cs, 9% Ds, and 4% Fs. (According to the DOE press release, 23% of schools overall received As, 38% Bs, 25% Cs, 8% Ds, and 4% Fs.)
Fully 80% of the schools that got F or D grades were rated as “proficient” or better in their quality reviews, while 37% of those that were rated unsatisfactory in their quality reviews got As and Bs on their report cards.
“I find the methodology to be confusing, problematic and flawed” … Ms. Horowitz said that the grade “doesn’t mean anything” to her, and that parents were planning a rally this morning to “celebrate our school.”
Update: see this NY1 story about the principal and parents at Muscota.


4 comments:
Leonie,
What's the source for the 34-80% random fluctuation in year-to-year changes in a school's test scores?
There's no source you can point to and say "ah there it is lets fix it". It is just a mathematical thing. The tests have to be written new each year and so fluctuations occur. It's like how you might be able to complete a crossword puzzle or sudoku one day and be stumped the next day.
Unitymustgo!
I wish I could have been at the Muscoda rally. Go Muscoda!
Actually the source is this --
Thomas J. Kane, Douglas O. Staiger, “The Promise and Pitfalls of Using Imprecise School Accountability Measures,” The Journal of Economic Perspectives, Vol. 16, No. 4. (Autumn, 2002), pp. 91-114. http://links.jstor.org/sici?sici=089
Kane and Staiger have written alot on the random nature of annual variations in test score results -- the smaller the school, by the way, the more random the annual variation.
Post a Comment