Thursday, August 4, 2016

Evidence grows we are entering a new era of mass delusion and test score inflation- including cut score manipulation

Update 8/5/16: Be sure to also check out today's blog post on this issue, including links to Daily News and NY Post articles and today's NYSAPE press release.

The results of the state exams were interesting, to say the least.  Statewide, the opt out rate grew with 25,000 fewer students taking these tests, and the non-participation rate statewide increased from 20% 22%.  Fully 95% of districts in the state did NOT make the threshold of 95% participation.  For more opt out stats, see the NYSAPE press release here.

As for the results, take out the champagne, celebrate along with Mayor de Blasio and Chancellor Farina; state and city proficiency rates were up!  “We have seen incredible improvement on these exams,” Schools Chancellor Carmen FariƱa said.  Incredible is right, in the literal meaning of the word. See the NY proficiency rates in English, showing jumps of  nearly 11 points in 3rd grade reading since last year and ten points in 4th grade reading?  These leaps just aren't believable -- and anyone who believes otherwise is really taking a leap of faith.  The increases in math were big too, if not quite as dramatic.


Only a few problems: the state tests this year were shorter, they were given untimed, and the translation from raw scores to proficiency levels radically eased. We have apparently entered a new era of  test score inflation.

See what happened in NYC schools between 2002-2009, with especially sharp gains in math scores between 2002 and 2009:

Similar to this year, the proficiency gains were also dramatic in ELA, from 51% of  NYC students proficient  in 2006 rising to 69% in 2009 ( though the DOE charts are no longer posted.)

Predictably, Bloomberg crowed and rode the wave to re-election and the renewal of mayoral control:

At a news conference at a school in the Bronx, Mr. Bloomberg trumpeted the results as evidence that mayoral control had produced revolutionary improvements and brought city students within spitting distance of state averages after years of mediocrity. “Our reforms are working,” Mr. Bloomberg said. “Our schools are heading in the right direction.” Even Randi Weingarten, the president of the teachers’ union, lavished praise on the mayor and his chancellor. “What we’ve seen in the last seven years is a cohesion and a stability and resources that we did not have beforehand,” she said.

Only as many of us knew then, and was eventually confirmed, the gains weren't real.    The improvements were not matched by the results on the NAEP, the more reliable national exams, and the tests and the scoring were shown to be easier each year.

Erin Einhorn, then a reporter at the Daily News, did an eye-opening experiment  in 2007.  She gave the 2002 and 2005 4th grade math tests to a bunch of 4th and 5th graders taking summer school at Brooklyn College.  The kids did far better on the 2005 exams, with 24 out of 34 getting higher scores, and only eight students getting lower ones. The p-values, or percent of questions answered correctly on field tests, and thus easier to get right, also increased rapidly between 2002 and 2005.

The test score inflation continued up through 2009, with sharp increases in proficiency similar to this year due to more predictable and easier tests.   The scoring also got easier; Fred Smith, testing expert, and others discovered that random guesses would yield a Level 2 on the reading exam.

When the bubble finally burst in 2010, and the scores were re-calibrated, this is what occurred:

So how do we know we have entered another era of test score inflation?

When one compares NYC and NY state scale scores on the more reliable NAEP exams between 2013 and 2015, the trend lines don't match up.  On the NAEPs, NY State and NYC 4th grade ELA, average scores declined slightly while on the state tests they increased. Because the NAEPs are only given every two years, we have no results for 2016.  (The state scores are in dark green and dark orange; the city in lighter colors.)
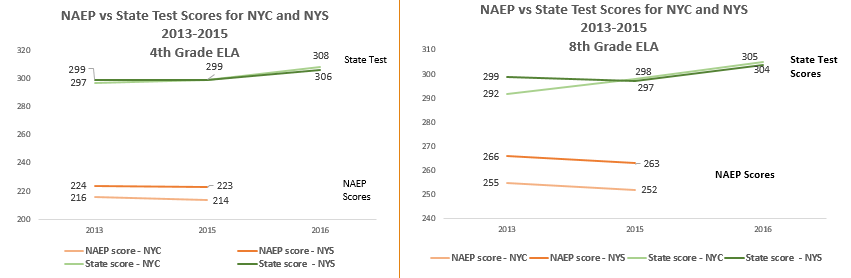

Similarly, in 4th grade math, NYC and NY State scores fell on the more reliable NAEPs while rising in state scores between 2013-2015. In 8th grade math, they fell on the state exams, while NYC increased a bit on the NAEPs.  The only trend line among the set of eight results that matches the NAEPS is 8th grade math, where state student scores fell as well.


But what about the claim made by DOE and the media that for the first time, NYC scores matched the state's?  See for example, this headline from Chalkbeat:  NYC reading scores leap, matching state average for first time.  This may have been true in proficiency rates, but certainly not in scores, which are considered a more reliable way to track achievement.

If you look at the charts above, you can easily see that NYC's average scores matched the state's last year in 4th grade reading and surpassed the state in 8th grade ELA. In addition,  NYC matched the state's average scores in 4th grade math in 2013, and in 8th grade math in 2015.

Yet as we see NYC did not match the State scores on the NAEPs, in 2013 or 2015, in any subject.  This creates even more doubt on the reliability of the state metrics and provides evidence that we have entered a new era of test score inflation.

Yet another reason to doubt ANY comparisons between city and state scores or proficiency rates is that 95% of the state's districts had more than 5% opt out rates -- and the 95% participation rate is supposedly required for accurate conclusions.  Meanwhile, NYC's opt out rate remained relatively low at 2.4% -- which makes any comparisons between NYC and the rest of the state even more questionable. 

But perhaps the smoking gun is this:  the state cut scores much lower this year, with far lower raw scores translated into higher scale scores which were then equated with higher Proficiency levels, meaning Level 3 or above. [Note:  this may not be called cut scores, which according to some test experts refers to the proficiency levels set to the scale scores, rather than to the raw scores.  In any case, the effect is the same.]

See the analysis done by  Michael O'Donnell of New Paltz Board of Education and checked by NYSAPE members.  See also the chart below -- showing the systematic lowering of the number and percent of raw scores equated to proficiency out of the total possible in 11 out of the 12 exams.  [Clarification: the numbers below in the boxes are the percentage of points out of the total number of points needed to get a Level 3.  For example, in 3rd grade ELA, a student had to get 34 points out of 55 (62%) to get a Level 3 in 2015, compared to 28 out of 47 (60%) in 2016.  And so on.  The state data showing the conversion of raw scores to scale scores and the conversion of scale scores to proficiency levels is here; feel free to do your own analysis! ] 


The fact that the number of points needed for a student to be considered proficient was so much lower this year is very fishy, and only justifiable if the questions were much harder. Yet few if any teachers reported that the exams were more difficult this year, and the Commissioner herself insisted the exams were "comparably rigorous" to last year.  Indeed, she had tried to mollify parents who complained they were too long by shortening the exams and giving them untimed -- both changes that would be apt to boost results, all things being equal.

What is somewhat different from the last time we experienced test score inflation is that the NYSED presentation to the public had a clear disclaimer that any trends in test scores over time could not be ascertained.   See this, from slide 5 of the NYSED powerpoint:


But then the Commissioner proceeded to ignore this disclaimer, and showed charts showing gains each year from 2013-2016, albeit with a tiny asterisk at the bottom, that said:

*Due to changes in the 2016 exams, the proficiency rates from exams prior to 2016 are not directly comparable to the 2016 proficiency rates

What to make of these logical fallacies? What to make of the fact that not only the Commissioner but the NYC press corps almost uniformly glossed over the contradictions in the NYSED presentation, by omitting any mention of the  state's history of test score inflation and confining any reservations to the 7th or 8th paragraph of their stories?  Indeed, the only reporters to confront  the glaring unreliability of the data head-on wrote worked for the Buffalo and Rochester papers.


There are four ways to artificially boost results on exams: 

1.       Make the tests shorter
2.       Allow more time to take them
3.       Make the questions easier
4.       Change the cut scores and/or translation from raw scores to performance levels.

It appears that the state made at least three out of the four changes listed above.   We won’t know if the questions were harder or easier until the state releases the P-values and provides other technical details. 


So yet again, we have a Mayor using these unreliable and possibly invalid test results to "prove" that Mayoral control works and using it for his political advantage.  Again, we have a State Commissioner who says the results show that the state's educational "reforms" are leading to more learning. Again, the NYC Chancellor and a UFT president are drinking the Koolaid, to justify their preferred policies.  This time, in addition, the charter schools are also touting the results to "prove" their superiority.  Will we have to wait years until a new Commissioner until the state admits the truth, as we did last time when Rick Mills was replaced by David Steiner?

Following the Chancellor Farina's press conference, a journalist wrote me, "Twilight zone. ...Collective self-delusion with the kids used as political chess pieces." It appears we are living through Groundhog's Day, over and over again.  As the well-known saying goes, “Those who cannot remember the past are condemned to repeat it."


Monday, August 1, 2016

Despite NYSED & Gates-funded efforts, Opt out grows across the state; impossible to claim growth in achievement

Though the Commissioner, the Chancellor, the Mayor and most members of the media claimed otherwise, the multiple changes in the test this year and the fact that they were administered untimed made it impossible to compare results from this year to the last to discern if the scores indicate improved achievement or not.  What we do know is that the numbers of students opting out did grow- with the test non-participation rate rising from 20% to 22%.

FOR IMMEDIATE RELEASE:  August 1, 2016
More information contact:
Jeanette Deutermann (516) 902-9228; nys.allies@gmail.com  
NYS Allies for Public Education (NYSAPE) www.nysape.org


NYSED Declares Scores Not Comparable, Opt Out Grows Across State

This past Friday afternoon, the New York State Education Department (NYSED) released the results of the 2016 NYS Common Core 3-8 ELA and math results. Despite expensive ad campaigns from Gates-funded advocacy groups and the distribution of "Anti Opt-out" toolkits by Commissioner Elia aimed at persuading parents to opt in to state tests, the test non-participation rate increased from 20 percent last year to 22 percent. 

As Chris Cerrone, a school board member and NYSAPE member from Western NY said, "Given Commissioner Elia’s public relation blitz across the state and all the interviews she did with the media, as well as all the money spent by the pro-Common Core groups, the increase in opt out numbers indicates that parents remain very concerned about the low quality of these tests and the direction of education in our state." 

An increase in test refusals were seen across the state, including in large urban districts like Buffalo and New York City. In only 5 percent of districts statewide --38 out of 686 -- was the test participation rate at or above 95 percent for ELA and math.  If the current proposed Every Student Succeeds Act (ESSA) regulations are adopted, this would mean that the state would have to punish the vast majority of schools by giving them low grades or imposing aggressive intervention plans. (see chart below)

“Despite the relentless and well-funded PR push back we received in the city, more and more parents are becoming educated on just how harmful standardized testing is for their children. The increase in opt-out is a significant win for immigrant families, students with special needs and students from low income households. Our grassroots approach is resonating with parents seeking true equity in public education,” said Johanna Garcia, NYC parent and Co-President of District 6 President’s Council.

"Overall, these exams not only demonize our students and teachers, but the entire city of Rochester. I will not allow my child to take an exam that does not accurately reflect her progress. I'm not against testing, but I am against tests with no educational value," Eileen Graham, Rochester parent of 4th grader and founder of Black Student Leadership.

Long Island districts again this year opted out in large numbers, some as high as 84%.  Many other districts also experienced over 50% of student refusing to take the tests. (see chart below)

Jeanette Deutermann, Long Island public school parent, the founder of Long Island Opt Out and a member of NYSAPE said, "The opt out movement continues to expand despite the aggressive campaign to thwart our efforts and marginalize our voices. Parents demand nothing short of a complete overhaul to our excessive testing system, a ban on the mining of sensitive personal data, replacement of flawed Common Core with research-based standards, and a permanent decoupling of evaluations from test scores."

Despite their own warning that this year's test scores could not be compared to last year’s because the tests were shorter and untimed, NYSED still claimed that increases in this year’s ELA scores over last year’s scores justified their continuing to implement the Common Core standards and Common Core aligned exams. These contradictory statements undermine NYSED’s credibility.

The reality is that without a more careful analysis of the tests themselves, their length, and the impact of giving them untimed, it is impossible to ascertain if achievement increased, decreased, or stayed the same as last year.  In addition, the fact that so few schools and districts had a 95% participation rate also undermines their reliability.  

“The fact that 95% of school districts in NYS did not meet the federal and state participation requirements significantly weakens the reliability and validity of test scores for accountability purposes. How can Commissioner Elia claim that these scores are valid or show any improvement in achievement,” asked, Jessica McNair, Central NY public school parent, educator, and Opt Out CNY founder.

“There is little doubt that parents will continue to exercise their right to refuse harmful state tests and right now it is imperative that Commissioner Elia and the Board of Regents advocate for a revision in the proposed ESSA regulations, or else face having to intervene in most of the schools in the state,” said Marla Kilfoyle, Long Island public school parent, educator, and BATs Executive Director  

"Parents were very concerned when MaryEllen Elia was named Commissioner, due to her links to the Gates Foundation in Florida.  Skepticism was withheld to give her the benefit of the doubt while changes were discussed.  However, her continued failure to address the concerns of parents have only further eroded confidence in her leadership and in the State Department of Education," said Lisa Rudley, Westchester County public school parent and founding member of NYSAPE.   
In response to increases in test refusal, Commissioner MaryEllen Elia attacked critics and claimed that parents refusing the state tests were unaware of “important” changes made to the tests. Bianca Tanis, Ulster County Public School parent and educator said, “The small changes and tweaks made by the NYS Education Department are simply not enough. Nothing has changed for the individual child and to suggest otherwise is just plain wrong.” 
Said Leonie Haimson, Executive Director of Class Size Matters: "Between 2003 and 2009, the NY State Education Department engaged in rampant test score inflation, by making the tests and the scoring easier, without admitting this.  After that, the bubble burst and the scores fell radically with the introduction of Common Core-aligned exams, when our Commissioner was intent on proving to parents their children and their schools were failing.  I fear that state officials are still manipulating the scores for political ends.  It is no wonder that New York parents do not trust these exams to give an accurate picture of their children’s learning." 
"NYSED must work more consistently with teachers, parents, and students, to create policy that supports whole child initiatives in every community. It’s tiresome to continue to sell our children and families short by engaging annually in narrow discussions about learning that only focus on ELA and mathematics, while continuing to neglect science, the arts, and civic engagement,” said Jamaal Bowman, Bronx public school educator and parent.

"Why would anyone support tests designed for over 60 percent of students to fail? If a teacher gave a test in her classroom where over 60 percent failed she would rightly question the validity of her test. This is insanity," said Tim Farley, Hudson Valley principal and public school parent. 
It is clear that the over-emphasis and misuse of test scores with questionable validity and no educational purpose continue to rob our public schools of valuable instructional time and resources. Until the leaders of public education in NYS begin to focus on closing the opportunity gap by addressing the inequitable resources in our schools and heed the demands of parents and educators for evidence-based and child-centered educational policies, the opt out movement will continue to grow. 

2016 Test Refusal Analysis - Public School Districts


ELA Tests
2016
# of districts - less than 95% participation
648
% less than 95% participation
94%
# of districts -  95% or more participation
38
% 95% or more participation
6%


Math Tests
2016
# of districts - less than 95% participation
655
% less than 95% participation
95%
# of districts -  95% or more participation
31
% 95% or more participation
5%


Test Refusal increase from ELA to Math
2016
# of districts
582
% of districts
85%


Test Refusals by Percent Thresholds
% of Districts*
20% and over test refusals
72%
30% and over test refusals
48%
40% and over test refusals
30%
50% and over test refusals
19%


*Based on NYSED math test opt out figures

# of public school districts (includes big five): 686


NYSAPE is a grassroots coalition with over 50 parent and educator groups across the state.
###